Are CDs Just as Good as Investing in the Stock Market?

Let’s get something straight up front: This is not a recommendation for any single stock or strategy. It is purely informational and its intended purpose is to help you look at logic versus emotion when it comes to your dollars. Now, having said that…
Unless you have been solely investing in the so-called Magnificent Seven Stocks, the markets have been a pretty dismal place for your dollars over the last couple of years. Alphabet, Apple, Amazon, Meta, Microsoft, Nvidia and Tesla are mega-cap technology bulls right now. The S&P 500 is up almost 15% year to date unless…you pull out these giants. Without them, the index would be negative for the year.
This means that one of two things is happening with your portfolio:
One…it is sailing! You have seen tremendous returns. If this is the case, you are probably highly concentrated in these seven stocks, which means you are taking a lot of risk.
Two…it is monotonous and frustrating! You are probably North of flat for the past few years, but not much. This probably means you have a fairly diversified investment portfolio…and you are possibly wondering if you need to do something different. After all, you can find CDs, treasuries and money markets in the 4 to 5 percent range. Why not have your money there?
Believe it or not, it is times like this that behavioral finance is just as important as the economics behind the finance. Let me introduce you to a phenomenon called “recency bias.” By definition, this is the “tendency for people to overweight new information or events without considering the objective probabilities of those events over the long run.“ 1
As a result, this is why people buy high and sell low or, in other words, they buy greed and sell fear.
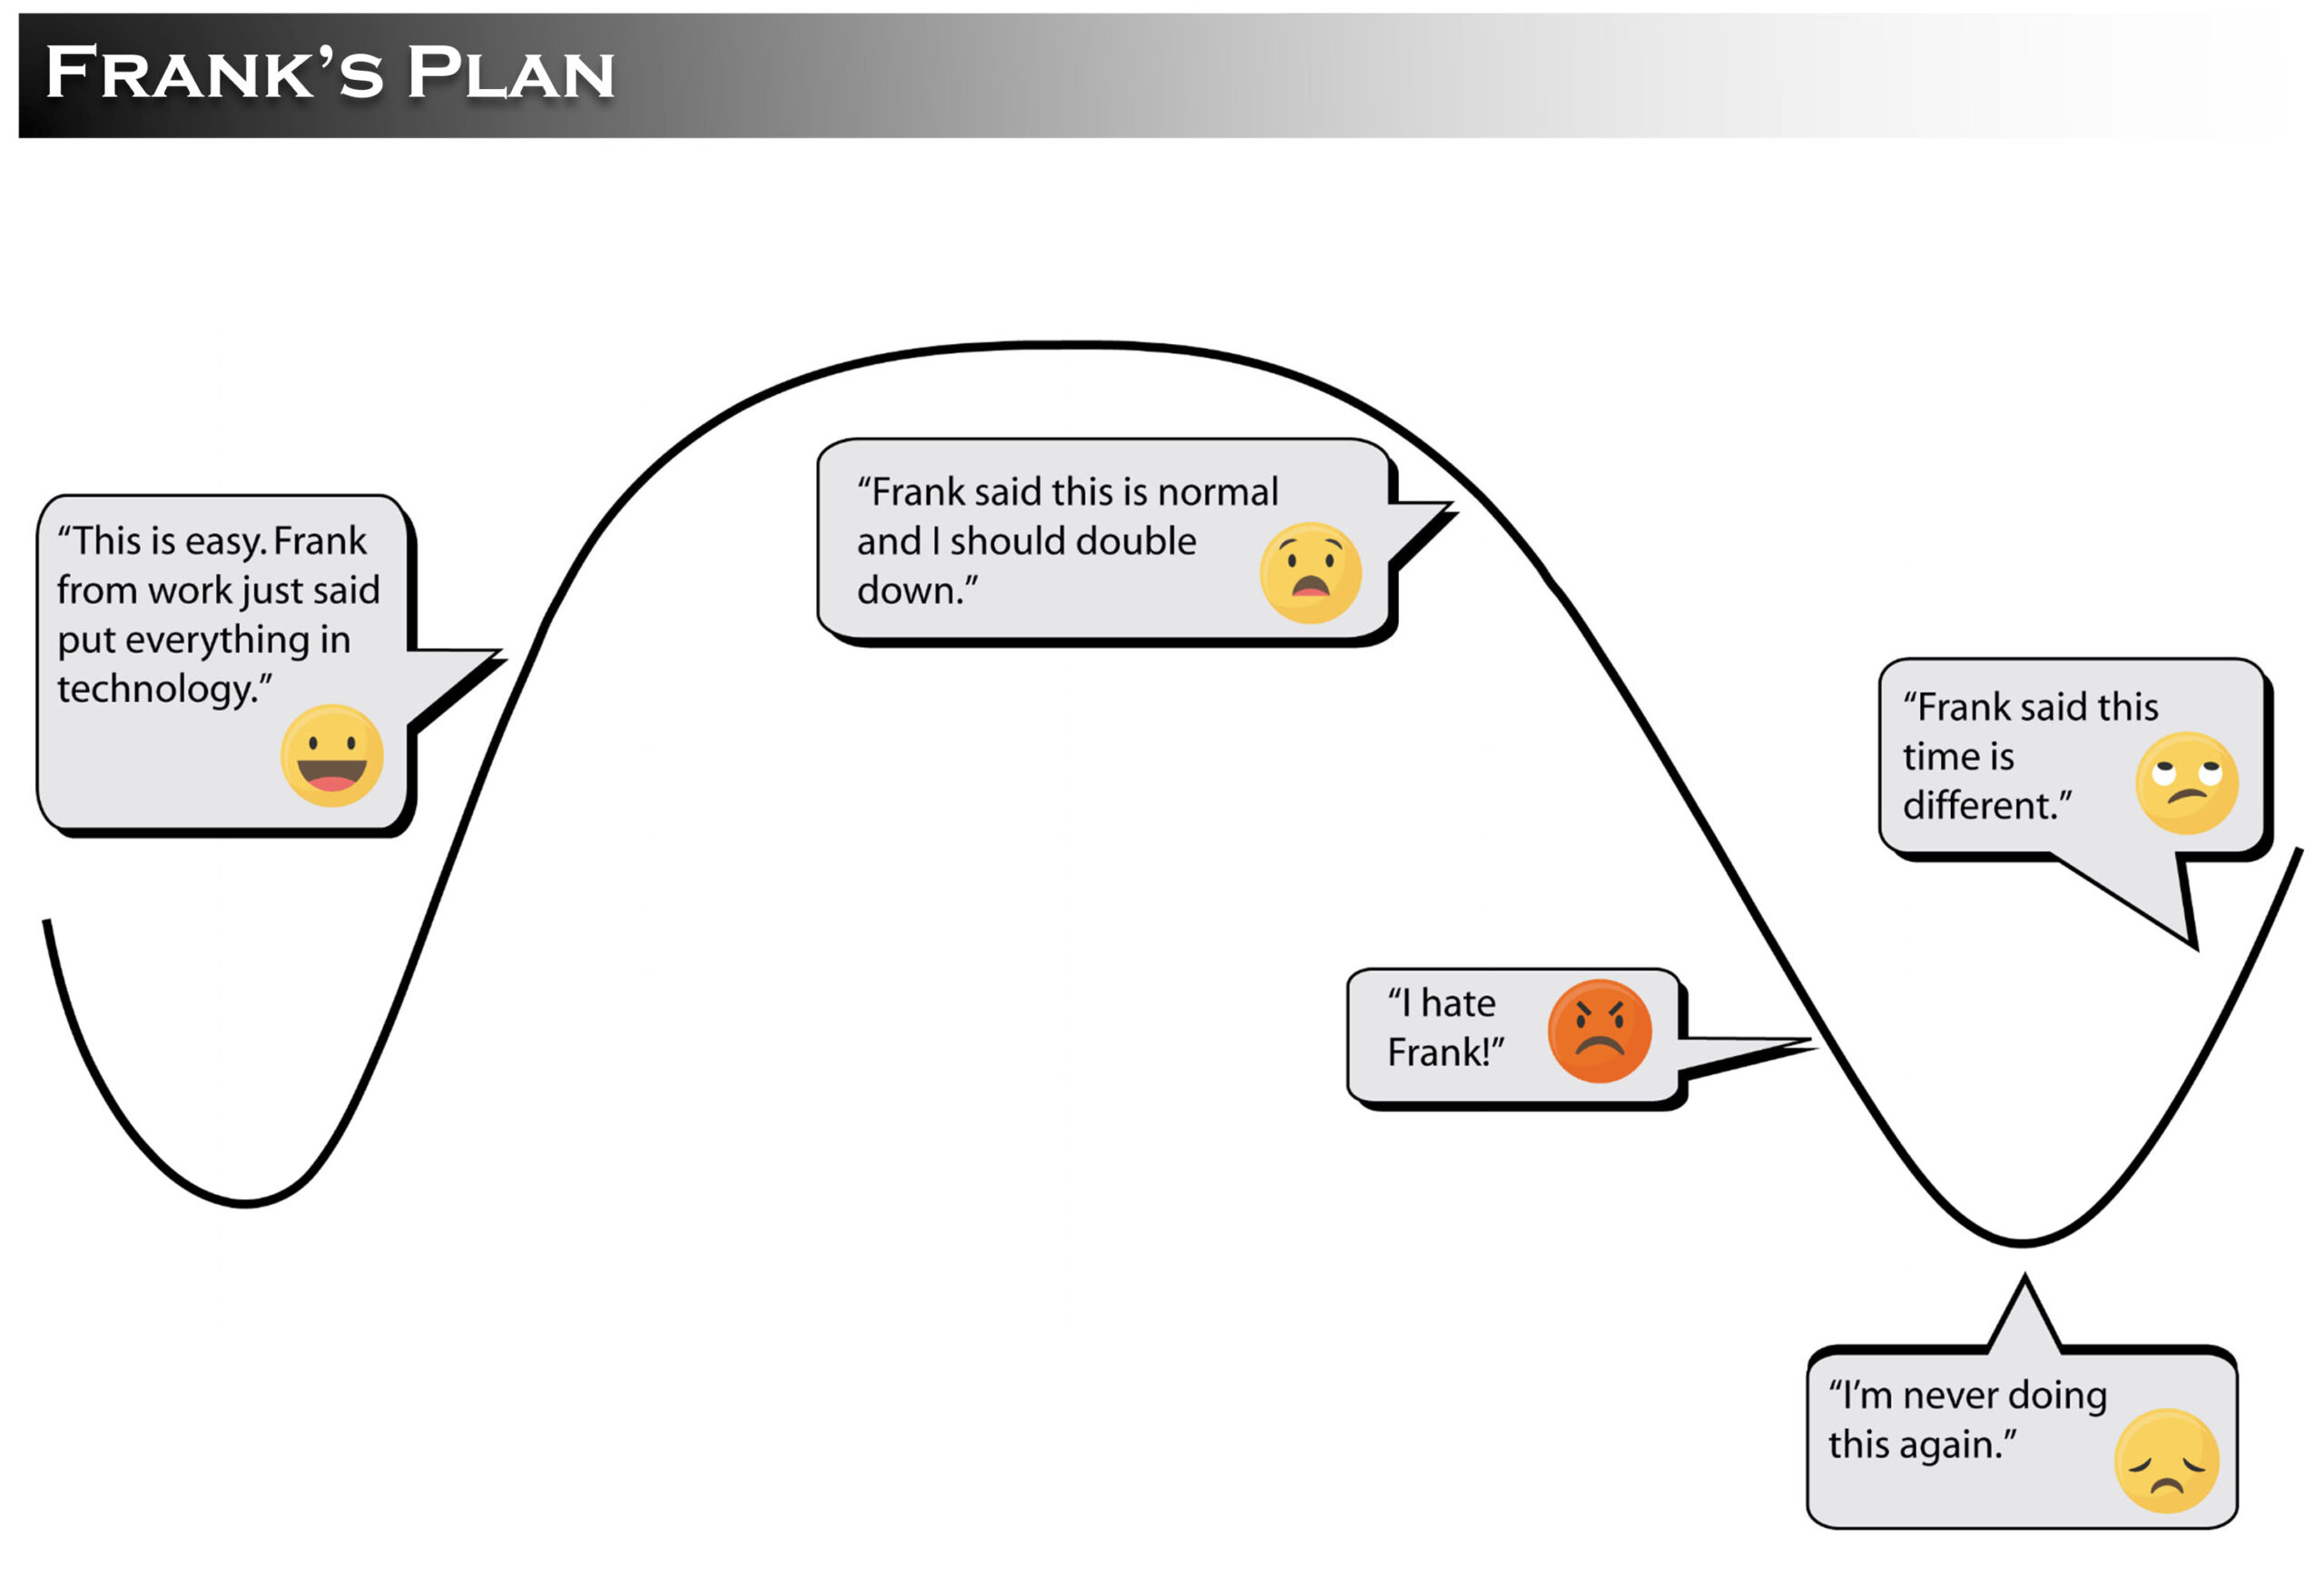
This image depicts emotional investing to a “t” for stocks, but what about CDs and other short-term instruments. Why not buy these and forget about all of that crazy volatility?
Let’s first take a step back and look at what is called the “after-tax real rate of return.” Then, we will get back to this question.
The after-tax real rate of return is what it implies. It is the return minus the cost-of-living adjustment (inflation) minus the taxes you pay on the return you made. The equation looks like this:
Return-Inflation-Taxes= After-Tax Real Rate of Return.
So, let’s glance at a 5% CD, 3.24% inflation and a 22% tax bracket.
(5%- 3.24%)-(5% *22%)= 0.66%
0.66 percent return is not near as swell as the 5% advertised. Honestly, this story isn’t new. Rarely do CDs actually produce a positive after-tax real rate of return. 0.66 is a good year for this financial instrument. When you compare this to a tax-managed portfolio, your current returns may look more in-line than you think.
Wait… are we missing the point? The more risk I take, the more return I should get. Is that not right?
There are never guarantees, but over time, this is true. There key words here, though, are “over time.” Unless you are a day trader, immediate gratification is a ridiculous expectation for a long-term investment portfolio. Economic cycles take time. The good news is that this is the first day of the rest of your life. I bet you have the time, and if your advisor has done their job, your portfolio should match this time frame.
This in turn answers the question—why don’t we just hang out in CD and short-term money land since we are getting the same returns as the market without all of the volatility?
The answer is simple—It is Black Friday—no pun intended. Without the Magnificent Seven, the majority of stocks are on sale or could be in the near future. If you believe in buying low and selling high, well…. you’ve answered your own question.
Now the only question left is if you have the patience to see the long-term economics through and let the markets do what they do…which historically has been climbing the wall of worries…
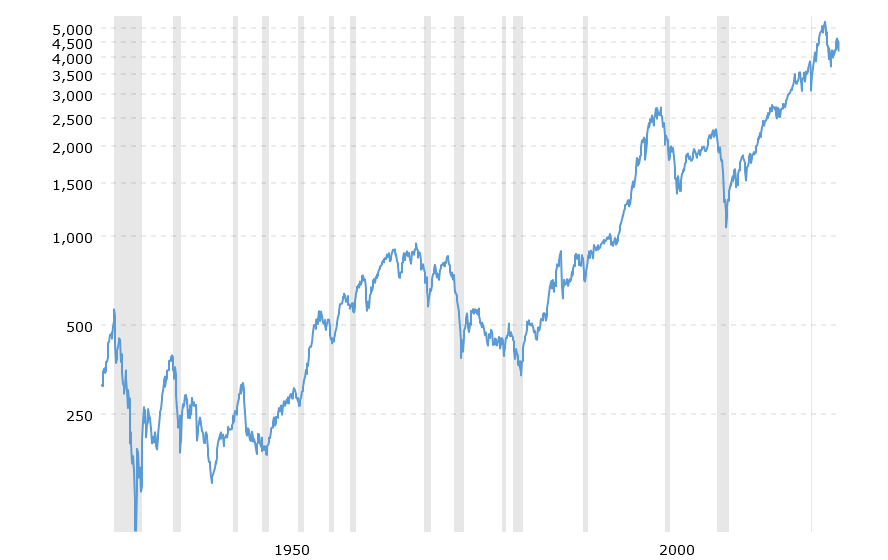
Source: https://www.macrotrends.net/2324/sp-500-historical-chart-data
As stated earlier, this is not intended to be a recommendation to buy or sell any financial instrument. There are also no guarantees or implied guarantees with these statements. Past performance is not indicative of future results.